GeoIQ
Make Your Maps Smarter
GeoIQ is a web services platform for developing intelligent mapping applications that empower people to explore, create and share geographic data and maps।
Learn More >
Make Your Maps Smarter
GeoIQ is a web services platform for developing intelligent mapping applications that empower people to explore, create and share geographic data and maps।
Learn More >
Tell Your Story with Maps
GeoCommons is a place to explore, create and share intelligent maps and geographic data.
Learn More >
www.geocommons.com >
Soon everyone will be able to find, share and use open source geographic data through a simple mapping interface on GeoCommons!
Browse through a treasure trove of public geospatial data, map and analyze the information, and up or download files in a few easy clicks! Check out our blog to stay up-to-date on the development of GeoCommons, and please be sure to contact us if you’d like to participate in beta testing
The value of geographic data multiplies when it can be combined and compared with other datasets covering different themes, geographic areas or time periods, for example. And it seems ridiculous to us that we should all be doing the same data processing tasks on our own, over and over again, or else paying for free data!
It will take the geographic community to help build a trove of high-quality data, but we intend to do our part by seeding the repository with a sizable collection of data sets. And we’ve developed ways to share knowledge about the data and make it easy for others to use it. We’re inviting our fellow geo-philes to do the same, so that the larger community of users can benefit.
Why a free geo data repository?
Those who work with geographic information know how much of a hassle it can be to locate and prepare it for use or how expensive it is to access information on demographics, commerce, the environment or crime, for example. Even though this data is often available for free from government sources, it’s difficult to use without proprietary software or significant technical know-how.
FortiusOne is working to change all that. We’re building a one-stop geospatial data shop for everyone—totally free! Our aim is to put an end to endless searching on the Internet for data, trying to decipher attributes and spatial projections, and struggling with proprietary data formats and software.
GeoCommons, Share Your GeoData
GeoCommons is a new mapping site that allows members to use a variety of datasets to create their own maps. It provides the free geodata, a map builder tool
http://beta।geocommons.com/
Beta.geocommons.com website statistics and traffic graphs on ...
Fast and free domain metrics for Beta.geocommons.com.www.statsaholic.com/beta.geocommons.com
If you work with geographic information (or have tried to), you know how difficult it can be to find data and how much of a hassle it can be to make data you find usable. On GeoCommons, you have access to a huge repository of high-quality geodata that is ready to use with a few simple clicks. GeoCommons includes a wide range of data in areas such as, population, environment, recreation, schools, crime, employment, traffic, politics, shark attacks and whatever wacky or edifying information the community contributes.
DATA
Where does the data on GeoCommons come from?
The data you find on GeoCommons is uploaded by members like you. Currently, GeoCommons includes data from a wide range of sources such as government agencies, non-governmental organizations, and neogeographers.
How do I know the data on GeoCommons is accurate? What if I find an error?
On each Data Profile page members can rate the dataset and will soon be able to leave comments about any issues they have found, which is an excellent way to help build a quality geodata repository. As with open-source software and wikis, the GeoCommons data will continue to improve via community contributions over time.
Can I upload my own data onto GeoCommons?
Sure! As long as you’re willing to share it with the GeoCommons community and abide by the Terms of Use, you can upload as much data as you would like. If you were looking for an answer that has more to do with how you can upload data to GeoCommons that’s not in KML or Shapefile format, try this answer.
Are there any restrictions on the use of the data on GeoCommons?
According to the GeoCommons Terms of Use, the data uploaded to GeoCommons must be made available to the community under a Creative Commons Share Alike - Attribution license. Essentially this means you can re-use the data as long as you attribute the source, but please refer to the GeoCommons Terms of Use and the Creative Commons Legal Code for more information.
What data formats does GeoCommons support? Can I upload data in Excel or some other format?
You can upload data to GeoCommons in the KML or KMZ formats supported by Google Earth or the Shapefile format supported by ESRI, and you can download data as KML and CSV files. If you want to add data in another format, like Excel for example, there are a number of resources you can use to convert it into KML and then upload it to GeoCommons.
You might like to try a beta service from terra IMS called geoXtract that provides a lot of useful functionality in one spot (it handles XLS, MDB and CSV files, for instance, geocodes U.S. street addresses, and lets you save and publish your map projects).
geoXtract, like a few other tools that convert data, is offered free for a basic version of the service. You might also like to check out BatchGeocode.com, KaMeLwriter, Juice Geocoder, EarthPlot and Mart Web Studio, which do some different things, like convert a GeoRSS URL into KML, for instance. If you’d like to enlighten us about these or any good tools for creating KML files from other data formats, please drop us a line.
Also, we’re always trying to make GeoCommons more useful, so if there are data formats you’d like to see supported, please let us know and we will take the suggestions into account!
Can I keep my data on GeoCommons private?
We expect to support private data in the future for an additional cost. If for some reason you just can’t wait and need to work with private data on GeoCommons right away, please contact us, indicating your need and giving us a little information about what you’d like to do.
Can I delete my data after I’ve uploaded it?
Sure. You can delete data you’ve uploaded at anytime.
What data projections does GeoCommons support?
GeoCommons uses the Google Maps API to provide base maps and satellite imagery. Google Maps uses the Mercator projection. Data uploaded to GeoCommons that’s in the Mercator projection or in an unprojected format should match up with the images and locations you see on the map.
Some geographic data, particularly at a more local scale, comes in other projections, however, and may need to be unprojected before you load it into GeoCommons. If you find data that doesn’t appear in the correct location on the map, this is likely the problem. If you’d like to find out what projection your data is in, you can read the metadata that usually accompanies geodata files. For Shapefiles, you can find this information in the .prj file.
Once you know the data projection, you can convert it to an unprojected format and then load it into GeoCommons. We will likely add support for other data projections to GeoCommons in the future. Please let us know if this problem affects you, and what projection your data is in.
HEAT MAPS
In general, a heat map is a visualization tool that is used to understand relative concentrations. Areas that appear hotter have relatively more of whatever things you are visualizing. For example, you could make a heat map of all the cities in the United States, and you would see that the Northeast appears hotter than the Midwest because cities are more geographically concentrated in the Northeast.
The heatmaps you see on GeoCommons are different because they take into account values as well as just location. This means that you can make a heatmap to visualize not just where there are more cities, but also where there are more cities with higher populations, for example.
What do the colors on the heatmap mean?
There are 3 basic things to remember when interpreting the colorful heatmaps you see on GeoCommons:
1) Bright = Hot = More.
2) Everything is relative.
3) There are no units.
One of the cool aspects of our heatmap technology is that it can make heatmaps of more than one dataset. So, if you wanted to find a neighborhood that had low crime rates and high school test scores, you could combine those variables into one heatmap. Since the units of the various datasets you combine are usually different (numbers of burglaries versus standardized test scores, for example), we have to normalize them. Normalizing means we get rid of the original units and replace those numbers with a relative score between zero and one. The highest value on the screen receives a score of one, and the lowest receives a zero. This way we have numbers that can be added together to make a heatmap from multiple datasets with different units.
The hotspots change as you move around the map because they show the highest and lowest values relative to the points visible on the screen. Every time you pan or zoom the map, the relative heat score is recalculated based on the data for the points in the new geographic view.
Why isn’t there a legend on the heatmap?
There is no legend on the heatmaps you see on GeoCommons because there are no unit values associated with the colors. So that you can view multiple datasets with different units on the same heatmap, we replace the unit values with a relative score between zero and one. The highest value on the screen receives a score of one, and the lowest receives a zero. This way we have numbers that can be added together to make a heatmap from multiple datasets with different units.
Why do the hot spots move when I pan or zoom around the map?
The heatmap generates color based on the values, or attributes, attached to the different points (or lines or polygons as the case may be) in the map viewer window. So, the heatmap indicates which points in view have relatively higher values and are closer together.
This means that when you move the map viewer to cover a new geography (zooming in or out or panning the map), the heatmap is recalculated according to the new view. See “What are heatmaps?” for more information.
Why do the data or the heat spots on my map appear to be located in the wrong place?
GeoCommons uses the Google Maps API to provide base maps and satellite imagery. Google Maps uses the Mercator projection. Data uploaded to GeoCommons that’s in the Mercator projection or in an unprojected format should match up with the images and locations you see on the map.
Some geographic data, particularly at a more local scale, comes in other projections, however, and may need to be unprojected before you load it into GeoCommons. If you find data that doesn’t appear in the correct location on the map, this is likely the problem. If you’d like to find out what projection your data is in, you can read the metadata that usually accompanies geodata files. For Shapefiles, you can find this information in the .prj file.
Once you know the data projection, you can convert it to an unprojected format and then load it into GeoCommons. We will likely add support for other data projections to GeoCommons in the future. Please let us know if this problem affects you, and what projection your data is in.
FOR DEVELOPERS
Can I develop my own application using GeoCommons?
Yes! GeoCommons is built on FortiusOne’s GeoIQ Web Services platform, which you can use to build rich geodata visuals into your own applications. When you sign up for a free account on GeoCommons, you automatically get a GeoIQ API key (shown on your Profile page). Please see the GeoIQ Developers page for more instructions. You might also like to check out or subscribe to the RSS feed on FortiusForge, where the dev team shares random and hopefully cool technology snippets.
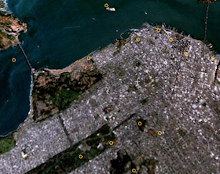
The map is based on data from the telephone records released by Ms. Palfrey aka “DC Madam”. It shows the total number of calls from phone numbers that share first six digits. The released telephone records were in TIFF format, these were digitized using OCR (Optical Character Recognition) software and then geocoded such a way the the last four digits were removed so the these numbers cannot be traced back to individual person. The telephone records are from billing information for the carrier Sprint.
View the Booty CallsGeoCommons - Google Maps Meet Heat Maps
May 28, 2007 — 11:08 AM PDT — by Stan Schroeder — Share This
GeoCommons is the latest mapping service which enables users to create geographic data and use it to create custom, intelligent maps. Think of it as the mix between Swivel and Google Maps.
It works like this: you can take a geographic data set and choose which parts you want to use. For example, say you want to use the calorie consumption in various US states dataset to create a map. You can take data from 2002 and 2003, and focus it so that only states above a certain number of calorie consumption are visible. Then, you export that to Google Earth’s KML or CSV format, and you get a nice, custom map. Or you can go to your GeoCommons workplace, search for data from there, and directly add it to your map (you can use several layers of data), which you can save and share with other users.
The maps themselves are based on Google maps, but the data is presented in the form of shapes and heat maps, which is visually very effective, but unfortunately, in practice it’s sometimes a bit slow.
GeoCommons is quite an advanced service, and although it can be used for fun, businesses, professionals, and geoenthusiasts will make more use of it than casual users. It takes a while to get used to all that it can offer, but once you do, the results can be very rewarding.
